
We build Osparna on the premise that the graph is only as good as its discipline about what's a real signal and what's noise wearing a signal's clothes. This week gave us a clean, concrete case of exactly that distinction, sitting inside what looked at first like a plain data bug.
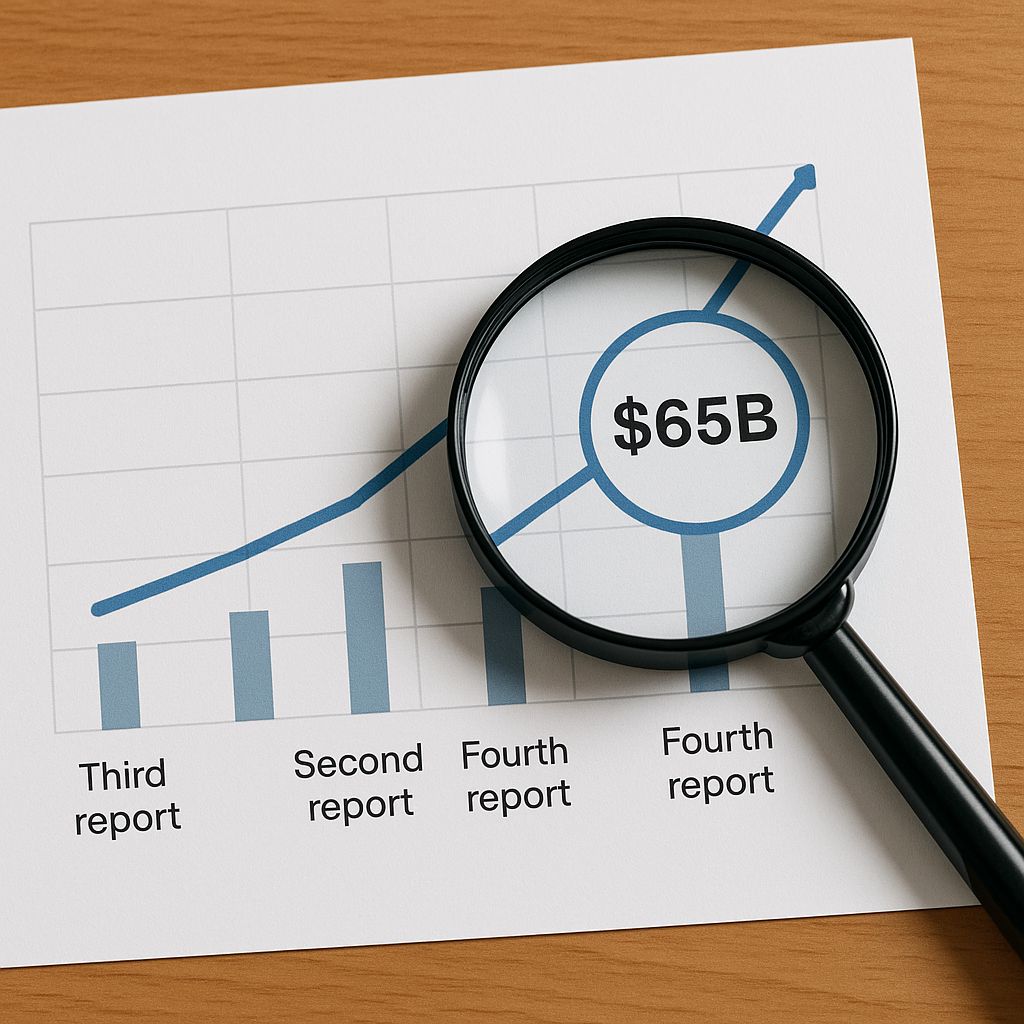
Auditing our own funding-rounds data, we found Anthropic's $65 billion round logged as four separate rows -- same company, same amount, four different dates a few weeks apart, each one tracing back to a different outlet's mention of the same event. The obvious fix is to call that a duplicate and delete three of the four rows. That's half right. For "how much did Anthropic actually raise," there's exactly one real answer, and the other three rows were noise in our own graph. But how many independent times an event gets reported is itself real information -- not about the round, but about how much attention it pulled relative to everything else that happened that week. Collapsing four rows into one and throwing the count away would have deleted that second measurement along with the duplicate data. So we didn't -- we built a real, structured count of independent mentions alongside the single canonical fact, rather than treating repetition as pure noise to average out.
Looking at that count across our own graph, the pattern is instructive on its own. Of 4,382 real funding rounds on record, 4,237 were mentioned exactly once -- the overwhelming norm. 145 were mentioned more than once, up to a high of 8. What's notable is how loosely that repetition tracks deal size: a $450 million round was mentioned 8 separate times, the same count as a $1.7 billion round nearly 4x its size. Blue Origin's $10 billion round -- one of the largest on record -- was mentioned only 5 times. Bigger checks draw slightly more repeat coverage on average, but the relationship is weak, not proportional. Whatever is driving attention, it isn't simply the size of the number.
This isn't unique to funding data, and it's worth knowing the mechanism differs by domain rather than assuming one explanation covers all of it. Harvard's Shorenstein Center found that in the 2016 presidential primary, one candidate received roughly a third of all coverage in the year before any voting happened -- and that the volume of coverage preceded his rise in the polls, not the reverse. A separate peer-reviewed study of IPOs found that media coverage clusters heavily in the legally defined "quiet period" between a company's S-1 filing and its actual offering, and that it measurably shapes retail trading behavior before the company has priced a single share. Three domains, three different reasons attention and event size come apart: a mega-deal draws repeat mentions after it's already real, a candidate's coverage volume can shape the very outcome it's reporting on, and an IPO's coverage clusters around a scheduled date whether or not that date turns out to matter.
None of that is an argument against paying attention to what's loud. It's an argument for knowing, deal by deal and domain by domain, whether volume is telling you something real or just telling you it's Tuesday and four newsletters cover the same beat. That's the discipline we're building into the graph -- not by ignoring what gets talked about, but by keeping "what happened" and "what got talked about" as two separate, honestly labeled numbers, so neither one gets mistaken for the other when a decision is actually on the line.
Sources and further reading: Shorenstein Center on Media, Politics and Public Policy, Harvard Kennedy School, "Pre-Primary News Coverage of the 2016 Presidential Race" (June 2016) · Reuning, K. (2019), "Media Coverage, Public Interest, and Support in the 2016 Republican Invisible Primary" (Perspectives on Politics) · Bushee, B. et al., "Does the Media Help or Hurt Retail Investors during the IPO Quiet Period?" (Journal of Accounting and Economics, 2020). A longer version of this piece runs on our research site: "What happened vs. what got attention".